GTSPP Data#
This notebook graphs temperature and salinity against time, as recorded in a dataset in the RIDDC ERDDAP server. I believe this is at one specific location (can be confirmed by checking the map at the ERDDAP server).
!pip install eofs
!pip install netCDF4
import requests
from netCDF4 import Dataset as NetCDFFile
import matplotlib.pyplot as plt
import numpy as np
%matplotlib inline
import matplotlib.pyplot as plt
#To use cartopy in a Colab notebook, I need a particular sequence of installs (as shown at this notebook: https://colab.research.google.com/github/adamlamee/CODINGinK12/blob/master/notebooks/quakes.ipynb#scrollTo=3LkZkXvnMAr4)
!apt-get -qq install python-cartopy python3-cartopy;
!pip uninstall -y shapely;
!pip install shapely --no-binary shapely;
import cartopy.crs as ccrs
import cartopy.feature as cfeature
from cartopy.mpl.ticker import LongitudeFormatter, LatitudeFormatter
from matplotlib.axes import Axes
from cartopy.mpl.geoaxes import GeoAxes
GeoAxes._pcolormesh_patched = Axes.pcolormesh
import calendar
import datetime
#making the url, opening the dataset:
url = 'https://pricaimcit.services.brown.edu/erddap/tabledap/erdGtsppBest.nc?station_id%2Clongitude%2Clatitude%2Ctime%2Cdepth%2Ctemperature%2Csalinity&longitude=-71.321&latitude=41.579&time%3E=1985-03-31T13%3A15%3A00Z&time%3C=2020-03-30T10%3A08%3A00Z'
r = requests.get(url, allow_redirects=True)
open('test.nc', 'wb').write(r.content)
nc = NetCDFFile('test.nc')
nc
#defining dataset variables:
time = nc.variables['time'][:]
time = nc.variables['time'][:]
mapvar = nc.variables['temperature'][:]
salinity = nc.variables['salinity'][:]
depth = nc.variables['depth'][:]
lat = nc.variables['latitude'][:]
#making a list of times for graphing:
timearray = []
for i in time:
timearray.append(datetime.fromtimestamp(i))
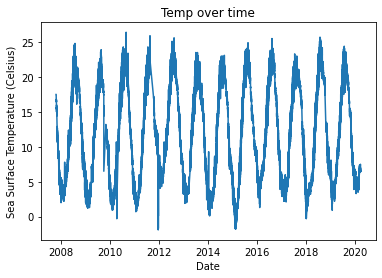
plt.plot(timearray, mapvar)
plt.xlabel('Date')
plt.ylabel('Sea Surface Temperature (Celsius)')
plt.title('Temp over time')
plt.show()
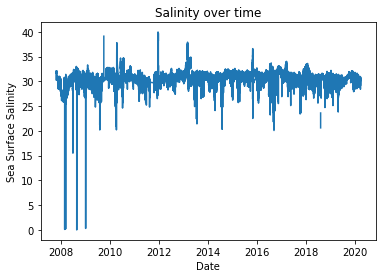
plt.plot(timearray, salinity)
plt.xlabel('Date')
plt.ylabel('Sea Surface Salinity')
plt.title('Salinity over time')
plt.show()
<function example_data_path at 0x7f860011eea0>
[6. 6. 6. ... 5. 5. 5.]