Very simple program, just mapping some salinity data from Aqarius (available in the RIDDC ERDDAP server). This code is a good starting point for learning how to work with the ERDDAP data through a Python notebook.
#the following installations and imports are necessary for google colab (once the installations are done they can be commented out):
%uv pip install netCDF4
%uv pip install erddapy
%apt-get install libproj-dev proj-data proj-bin
%apt-get install libgeos-dev
%pip install cython
%pip install cartopy
%pip install display
from netCDF4 import Dataset as NetCDFFile
import matplotlib.pyplot as plt
import numpy as np
import cartopy.crs as ccrs
3 month data
#TODO This dataset does not exist on ERDDAP
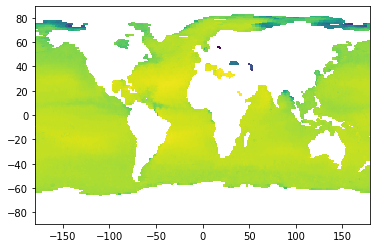
#this cell does mapping for the 3 month Aquarius data
mydata = NetCDFFile('https://erddap.riddc.brown.edu/erddap/griddap/jplAquariusSSS3MonthV5')
#the first part of the url is 'https://erddap.riddc.brown.edu/erddap'. That's just the riddc erddap webpage.
#the second part of the url is '/griddap'. That tells it whether you want gridded or tabular data (for tabular it would be '/tabledap')
#the third part of the url is '/jplAquariusSSS3MonthV5', which gives the Dataset ID
#the following lines define some data variables:
lat = mydata.variables['latitude'][:]
lon = mydata.variables['longitude'][:]
time = mydata.variables['time'][:]
sss = mydata.variables['sss'][:]
#plotting:
plt.figure(1)
plt.pcolor(lon,lat,sss[0,:,:])7 Day data
#this cell does mapping for the 7 day Aquarius data
mydata = NetCDFFile('https://erddap.riddc.brown.edu/erddap/griddap/jplAquariusSSS7DayV5')
lat = mydata.variables['latitude'][:]
lon = mydata.variables['longitude'][:]
time = mydata.variables['time'][:]
sss = mydata.variables['sss'][:]
plt.figure(1)
plt.pcolor(lon,lat,sss[0,:,:])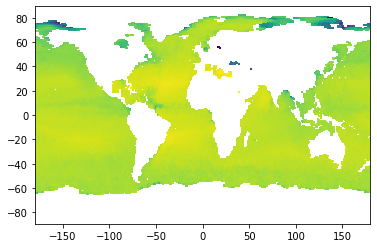
Daily data
#this cell does mapping for the daily Aquarius data
mydata = NetCDFFile('https://erddap.riddc.brown.edu/erddap/griddap/jplAquariusSSSDailyV5')
lat = mydata.variables['latitude'][:]
lon = mydata.variables['longitude'][:]
time = mydata.variables['time'][:]
sss = mydata.variables['sss'][:]
plt.figure(1)
plt.pcolor(lon,lat,sss[0,:,:])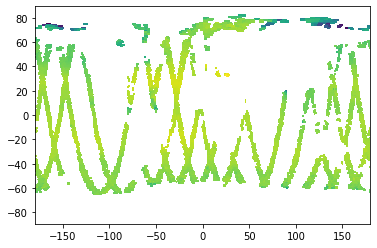
Monthly data
#this cell does mapping for the monthly Aquarius data
mydata = NetCDFFile('https://erddap.riddc.brown.edu/erddap/griddap/jplAquariusSSSMonthlyV5')
lat = mydata.variables['latitude'][:]
lon = mydata.variables['longitude'][:]
time = mydata.variables['time'][:]
sss = mydata.variables['sss'][:]
plt.figure(1)
Image = plt.pcolor(lon,lat,sss[0,:,:])