Author of this document: Benny Smith 
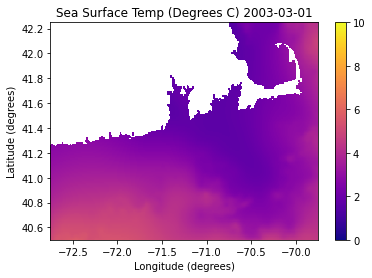
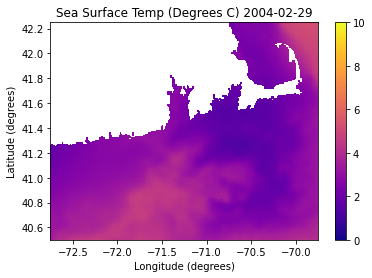
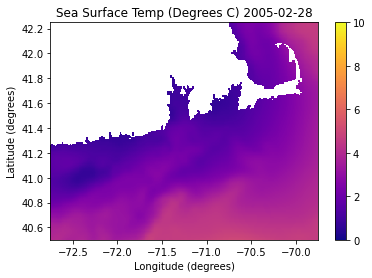
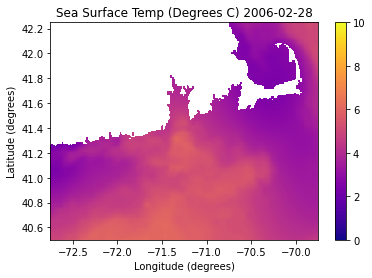
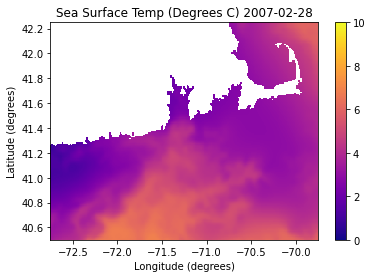
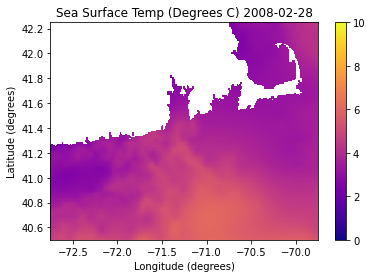
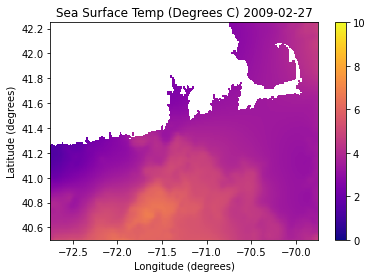
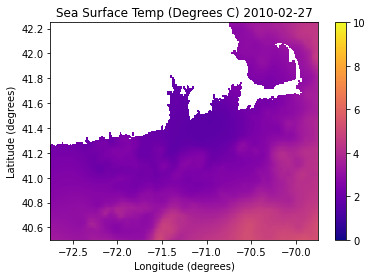
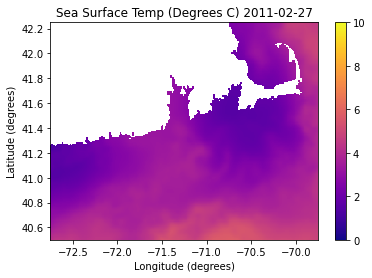
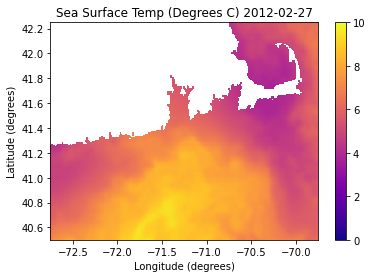
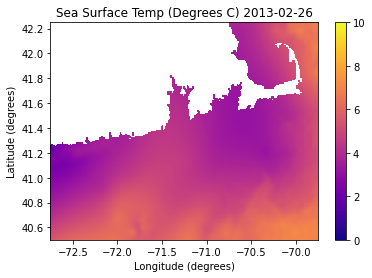
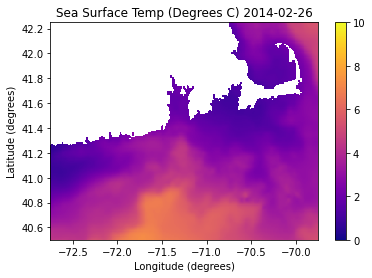
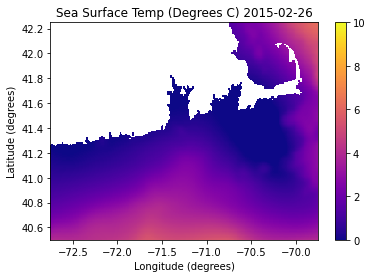
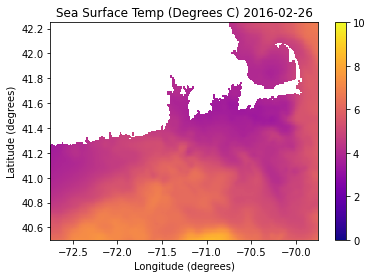
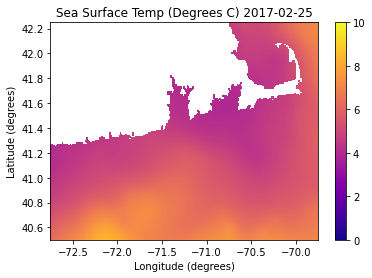
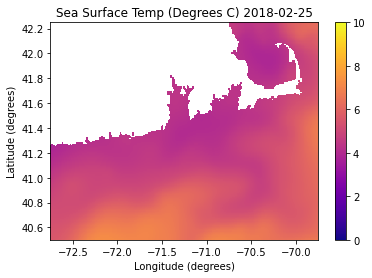
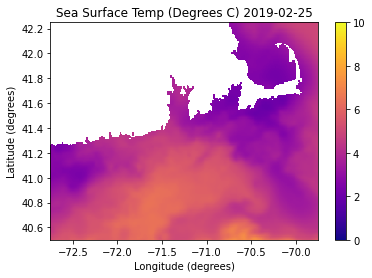
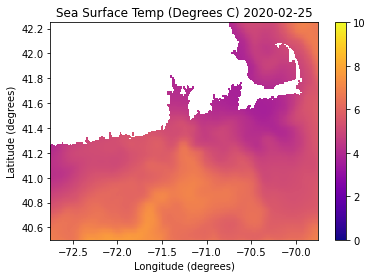
This notebook maps the sea surface temperature in the waters around Rhode Island at a set of times, as specified in the program. The dataset’s resolution is high enough that it should be able to capture the entire region modeled by OSOM, and could be used for climatologies and other means of comparison between model output and observation.
In the maps shown, note the ocean heat wave of 2012.
# install for colab
%pip install netCDF4
#first, some installs and imports:
import requests
from netCDF4 import Dataset as NetCDFFile
import matplotlib.pyplot as plt#the code dealing with datetime here is based on code at this link: https://stackoverflow.com/questions/1060279/iterating-through-a-range-of-dates-in-python
#from google.colab import drive
#drive.mount('/content/gdrive')
#images_dir = '/content/gdrive/Shared drives/BFK_BOG/SURF_UG/Benny/Images/jplMURSST41'
import numpy as np
from datetime import date, timedelta
dates2 = []
#making a list of dates:
start_date = date(2003, 3, 1)
end_date = date(2020, 6, 2)
delta = timedelta(days = 365)
while start_date<=end_date:
dates2.append(str(start_date))
start_date += delta
def make_url():
for i in dates2: #looping through the list of dates
#making the url and opening the dataset:
url = 'https://pricaimcit.services.brown.edu/erddap/griddap/jplMURSST41.nc?analysed_sst[('+i+'T09:00:00Z):1:('+i+'T09:00:00Z)][(40.5):1:(42.25)][(-72.75):1:(-69.75)]'
r = requests.get(url, allow_redirects=True)
open('test.nc', 'wb').write(r.content)
nc = NetCDFFile('test.nc')
nc
#defining some dataset variables:
lat = nc.variables['latitude'][:]
lon = nc.variables['longitude'][:]
time = nc.variables['time'][:]
sst = nc.variables['analysed_sst'][:]
plt.figure(i)
myplot = plt.pcolormesh(lon, lat, sst[0, :, :], cmap = 'plasma', vmin = 0, vmax = 10)
plt.title('Sea Surface Temp (Degrees C) '+i)
plt.colorbar()
plt.xlabel('Longitude (degrees)')
plt.ylabel('Latitude (degrees)')
plt.show()
#plt.savefig(f"{images_dir}/Sea Surface Temp (Daily) "+i+".png")
make_url()Go to this URL in a browser: https://accounts.google.com/o/oauth2/auth?client_id=947318989803-6bn6qk8qdgf4n4g3pfee6491hc0brc4i.apps.googleusercontent.com&redirect_uri=urn%3aietf%3awg%3aoauth%3a2.0%3aoob&scope=email%20https%3a%2f%2fwww.googleapis.com%2fauth%2fdocs.test%20https%3a%2f%2fwww.googleapis.com%2fauth%2fdrive%20https%3a%2f%2fwww.googleapis.com%2fauth%2fdrive.photos.readonly%20https%3a%2f%2fwww.googleapis.com%2fauth%2fpeopleapi.readonly&response_type=code
Enter your authorization code:
··········
Mounted at /content/gdrive
/usr/local/lib/python3.6/dist-packages/ipykernel_launcher.py:24: RuntimeWarning: invalid value encountered in greater